Yes - yes, I’m well aware that there’s already a fair amount of PostgreSQL specific monitoring tools out there - see for example see here for a non-exhaustive listing from Postgres Wiki (but there are some more, couldn’t find PgHero). But nevertheless, I was still missing something. I think the main problem that always annoyed me was that all the tools required either too much setup and were too invasive (think about installing an extension and restarting the server) or were too inflexible - just gathering and showing information that someone thought was a good idea.
Table of Contents
Yes, this Apple-style approach might produce visually appealing results most of the time, but it also makes your life really hard if you want to tune something or you find a bug and the tool maintainers seem to be on holidays sipping Margaritas somewhere. You’ll then end up pulling out a lot of hair because you need to quickly dive into Perl, Python, C, Java, younameit. So what could be improved? What should be the main characteristics of a ‘brave new’ type of monitoring application?
Simplest installation should be fast and non-invasive, should require no knowledge of inner workings of Postgres nor knowledge of some programming language, compiling etc. These requirements limit the options heavily, but in today’s world this mostly means relying on Docker, which already works on almost every platform. For the other platforms where Docker is not an option, it can still be installed from the sources, but users need to take some more steps then.
GitHub link here. Community help very much appreciated!
Pgwatch2 doesn’t require any modifications to the database server for main functionality, acting as a remote agent, executing normal queries over the network to read metrics and stores the results that are later used for graphing.
People will want to use your program for cases which you even couldn’t have imagined, inventing new metrics as they go. Braking changes will someday find their way into core Postgres. And then you want to be able to go in an spend maybe 10 minutes to customize the new/changed metric and be done. In our case this means sticking to good old SQL for defining metrics. It has the big upside that everyone working with databases can more or less grok it.
As life has shown recently on many levels, it all comes down to data. If it’s easily accessible everyone can build on it from there. So in pgwatch2 context this means betting on one of the most popular Time Series Databases around – InfluxDB. Written in Go, it offers great performance, very good data compression and easy data discovery - true after learning another SQL-like query language called InfluxQL. But luckily to use pgwatch2 you don’t really need to care about it, only when you want to implement something on top of the metrics data yourself.
I have first-hand experience from maintaining the also quite popular and nice Postgres monitoring solution PgObserver - that building nice UI-s on metrics is hard, really hard. Especially for database/backend developers. All the countless Javascript frameworks, multitude of devices, etc. So for pgwatch2 we decided to leave it to professionals and stick to the best dashboarding (free graphing) solution out there – Grafana. This means that we’ll only provide some predefined dashboards (and data of course) and users can easily and intuitively compile exactly graphs/tables/counters the way they like to see them. Less work for us – great! We’ll also provide a thin administrative web UI but with the main goal of managing databases and metrics that should be monitored.
“Installing” pgwatch2 in its default all-included form, which should satisfy most of users, couldn’t be much simpler. Given of course that you have previously installed Docker on the machine meant to act as the monitoring server:
|
1 2 3 |
# start the latest docker image in the background docker run -d -p 3000:3000 -p 8080:8080 --name pw2 cybertec/pgwatch2 |
After that you can wait a minute for Docker to initialize and then you can already start inspecting metric graphs using predefined dashboards via Grafana on port 3000. If you can’t try it out currently please take a look at the screenshots above.
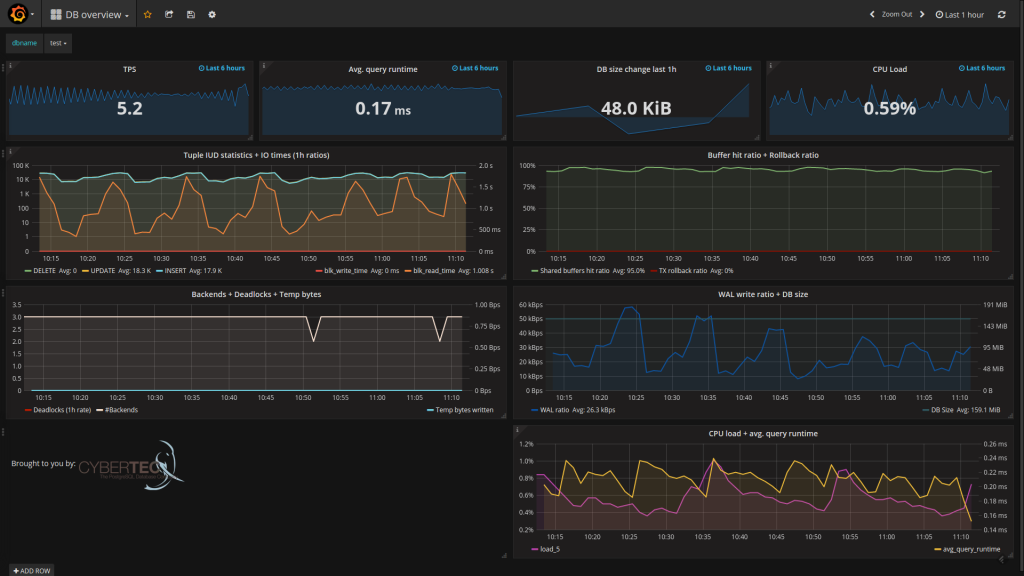
This is how the default DB overview page should look like:
Next step after starting the Docker image would be of course starting to monitor metrics from your own PostgreSQL database. For that you need to add the connection string of your “database under monitoring” to pgwatch2, so that internally a new statistics fetching process could be started. For that there’s a small Web UI on port 8080 (by default no authentication). Through the UI (see screenshots above) you can configure the connection details (host, port, user, password) following the example of an already existing entry that is actually the pgwatch2 configuration database running inside Docker. After 5 minutes you should already be able to see graphs for your own database.
NB! Make sure your monitored database server is accessible from inside Docker (possible problems with pg_hba.conf rules) and user/role used for monitoring is allowed to query pg_stat_* statistic views (allowed by default even for non-superusers). When things still don’t seem to function you may want to check the logs which are available from the Web UI, “docker logs” can’t currently help too much here as it provides logs for the management process only. Also note that the default data retention period for metrics is 3 months! It can be easily extended though with an InfluxDB administrative command.
Out of the box gathering and storing of almost all metrics provided by Postgres Statistics Collector subsystem (pg_stat_* views) is possible. Users just need to enable the accordingly named metrics per database as mostly it doesn’t make sense to monitor flat out everything. To enable choosing the right amount of monitoring details there are some predefined monitoring configurations available (e.g. named descriptively “basic”, “exhaustive”) and user can peek into their definitions and choose an appropriate one or create their own configurations consisting of metric names and monitoring intervals in seconds, represented as JSON. A list of available metrics together with some instructions is visible also on the Grafana "Documentation" dashboard.
A “metric” in this context means a named SQL query that returns some columns with values – text, integers and floating point numbers are supported, and you can (and should) create your own metrics as it is very easy. Just add the query selecting something from the statistics views (or even normal tables i.e. you can do business process monitoring!) via the UI, just making sure the query executes fast (5s timeout currently) and additionally all metric queries should also return an “epoch_ns” column (seconds since the Unix epoch in nanoseconds, but this you can copy from existing metrics) to record the exact time of the metrics snapshot. Columns can optionally also be “tagged” or “indexed” in the storage backend (InfluxDB) by prefixing the column names with “tag_” - for such columns Grafana will also provide nice data discovery features and queries will be faster on them also.
When talking about dashboard here we mean Grafana dashboards, that are basically a set of graphs/counters/tables on a single page, giving you an overview over something, all depending on the data you have. Most importantly - you can quickly visually compose dashboards yourself by just clicking around! Everything is pretty self-descriptive, you’ll be provided a list of available databases and metrics etc, but it will still take about an hour of trying and reading to really master it - but the investment will pay itself off many times. Note that for creating your own dashboard you should log into Grafana as “admin”! Default password can be found from the README and after logging in you can also tune any other settings and create new users.
From our side there are currently 5 predefined dashboards provided:
There are of course some more internal details to this solution (the metrics gathering daemon implementation, the configuration DB, metric fetching helpers for reading the CPU load and pg_stat_statement data, alerting possibility, security aspects, etc) and some questions might be left unanswered but this you can look up from the source code or from the README, and I do also plan to write another blogpost on the details soon.
But right now the most import thing for us would be to get some initial feedback from you - what do you think about the described approach? What do you like and what could be improved in your opinion? It’s also a very new software of course so please report all strange sightings. Thanks a lot!
pgwatch2 is constantly being improved and new features are added.
+43 (0) 2622 93022-0
office@cybertec.at
Hi Kaarel,
I have a few questions and still facing some issues in configuring our single database for monitoring.
I have issues #184,#185,#186 opened for these questions, but wanted to touch base here also for your help.
Questions:
--------------
Question 1. We already have the test configuration db within the pgwatch2 docker container. How do we drop it or revert it, and, then create the configuration db in the database itself?.
Question 2. What docker command do we run to create the configuration db in our database? Do we create it by running scripts ? And, how do we locate these scripts?
Question 3. Do we have any zip/tar file that we need to download from GitHub or these scripts are already available when we downloaded the pgwatch2 docker image?
Issues:
---------
Following the section "Steps to configure your database for monitoring"
we ran the following statements to monitor our database (cemtore) logging in using the superuser (cemtore)
-bash-4.2$ psql -U cemtore -f stat_activity_wrapper.sql cemtore.
We then run cemtore=# CREATE EXTENSION pg_stat_statements;
CREATE EXTENSION
cemtore=# CREATE EXTENSION plpythonu;
ERROR: could not open extension control file "/usr/share/pgsql/extension/plpythonu.control": No such file or directory
And, in the admin interface, we added our database with the following values:
DB db name - cemtore
DB db user - cemtore
Auto-create helpers button selected
Preset metrics config - full
But we are still not able to see the CPU utilization in DB overview screen , and we are not seeing anything in the system stats screen.
Question - Is it because of not being able to create the plpythonu extension? How do we resove the plpythonu extension error?
Hello, Pgwatch2 is a great tool, I really appreciate it. I found a small bug, maybe it is my misunderstanding how it works. After reboot VM or restart container there is no web.py process, dbs page of course does not working and file /pgwatch2/webpy/web.py does not exists.
Workaround:
mkdir /pgwatch2/bck_webpy
cp -ipr /pgwatch2/webpy/* /pgwatch2/bck_webpy/
sed -i '$d' /etc/rc.local
echo "cp -ipr /pgwatch2/webpy/* /pgwatch2/bck_webpy/" >> /etc/rc.local
I played with the software yesterday and while I think I love it, I do have a few questions that don't seem to be answered in the GitHub documentation.
1. I have a database server with 10 database in it. I want to monitor all of them. I created the pgwatch2 role but not sure how to add each database in the DBs part of the web admin. When I add the pgwatch2 role, I get the all, grafana connections but not each database. I'm not sure if this is normal or I'm doing something wrong.
2. When loading the stat_activity_wrapper.sql file, do I need to do that for each database I want to monitor or is there a way to load it for all databases at a single time?