Recently, I was asked whether Postgres was “covered” in the area of common reporting needs? By reporting I mean ad hoc or predefined chart generation, mostly drag-and-drop style software, used most commonly by Business Intelligence people. The answer is “yes” - you can do reporting on PostgreSQL as easily as with other popular databases.
Table of Contents
But what options are out there more specifically? So here’s a small list on some popular options I’m aware of. As a disclaimer, I have to say that I don't have to deal with reporting too often so it’s not a definitive list in any way, there are dozens and dozens of options out there, and I haven’t used all the listed ones but just seen them used or being talked about.
* Tableau
Tableu is definitely one of the most popular and feature rich options. Besides the basics, it provides all kinds of fancy visualizations (geomapping, treemaps, Gantt charts) and supports both ad-hoc queries and loading data to their server for even more options. Commercial product.
* Microstrategy
Microstrategy provides charting but is more of an enterprise analytics suite with a huge feature-set covering all analytics needs - visualizations, predictive analytics, alerts. Commercial product.
* JasperReports
JasperReports is the most popular Open Source reporting software with all the modern features (visual designers, mobile apps) in the Open Source version and even more advanced stuff (ETL, Hadoop integration etc) available in the paid commercial edition.
* QlikView
One of the veterans of business intelligence & visualization software. Quite user friendly but one needs to load data to QlikView first. Commercial product.
NB! For successful ad hoc reporting you should normally make sure your data more or less fits into RAM or you should at least have very fast disks (SSDs).
When your requirements are not so “enterprisy” (you’re ready to set up some software and write some SQL-s) and you’re OK with just the most common graph types, then you also have some options.
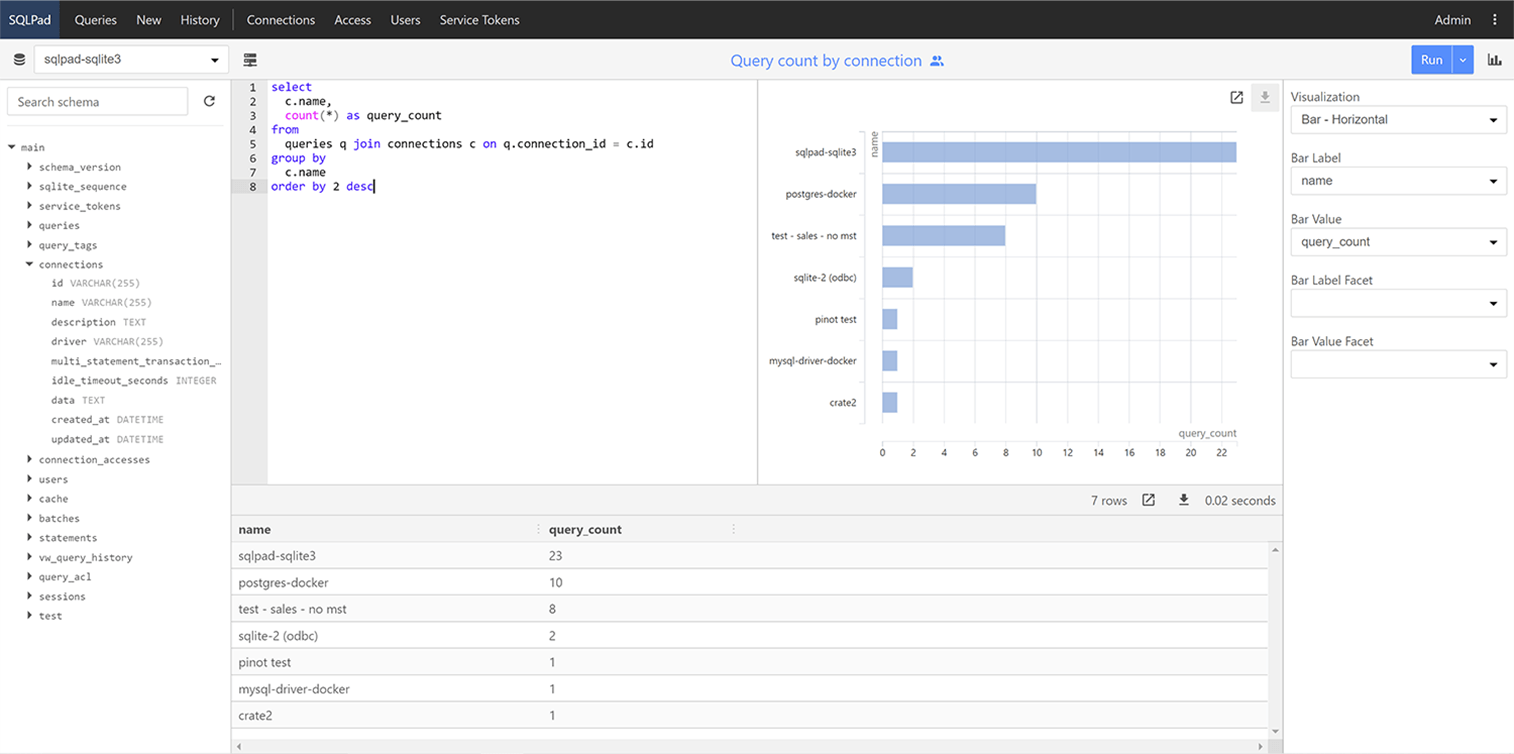
* SqlPad
Currently for my own needs this very active Open Source project would be my first pick. It has all the basic chart types, plus a way to share charts among users. See the SqlPad project Website for more. It looks something like that:
* pgcharts
Simplistic charting for Postgres. Project doesn’t seem to be too active nowadays though. See the GitHub project here.
* Pull the data to you spreadsheet program for DIY charting
Maybe not exactly the most convenient method, but you can still quite easily fetch data from your Postgres database to Libre(Open)Office or MS Excel and do your charting there. How to do it for LibreOffice Calc, for example, can be seen from this YouTube video here and in the end it would look something like my screenshot below. Note that you need also LibreOffice Base and libreoffice-sdbc-postgresql driver (sudo apt install libreoffice-sdbc-postgresql libreoffice-base on Ubuntu).

Please write a comment if there are some other good options out there!
+43 (0) 2622 93022-0
office@cybertec.at
redash?
Microsoft's Power BI also has a connector for PostgreSQL, have not tried it yet though.
Great post - there really are some powerful reporting options out there for PostgreSQL databases. Another one I'd add is QueryTreeApp.com.
It fits under the 'lightweight' category as it's cloud-based. But it still packs quite a punch. Every time I use it I'm sort of blown away by how quick it is to create reports and visualizations from start to finish - and then just schedule them via email.
QueryTree won't give you the level of detail Tableau does but for nimble, regular reporting with some automation thrown in I'd say it's one of the best.
Pentaho Report Designer is an awesome opensource solution. Have visual query builder, can be executed via WEB (with a UI or passing parameters directly in URL). The only lack is the poor formulas for date/time manipulation, but it can be resolved by writing your own expessions.
http://community.pentaho.com/projects/reporting/
One more option for 'lightweight BI' category: https://www.seektable.com
This is free cloud tool for ad-hoc reporting (pivot tables, pivot charts) that can connect directly to PostgreSQL; there are no ETL: it produces queries on-the-fly and you always get actual data.
Open-source UI Framework : https://github.com/airbnb/superset