It’s been quite some time since I last wrote about our Open Source PostgreSQL monitoring tool called pgwatch2, but now there’s again a reason for it – it got a lot better again! Updates for the pgwatch2 Postgres monitoring tool include multiple new feature updates per requests from users and also some bugfixes. So this is a quick overview of new stuff here.
First some words about pgwatch2 – it’s our relatively new (released in January) PostgreSQL monitoring tool, aiming to provide a nice balance between features / usability / out-of-the-box experience, concentrating on nice graphs using Grafana. The philosophy behind the software could be formulated as “simple but flexible”. Basically, it tries to do the minimum itself and let other existing software components to do the rest. Users can also easily define their own metrics with SQL and graph them however they want. It’s especially good for ad hoc monitoring, as getting started with pgwatch2 is a one-liner thanks to Docker.
Below is a listing of new features so feel free to check out that latest version and let us know on GitHub if you’re still missing something in the tool or are having difficulties with something. Any feedback would be highly appreciated!
Project GitHub link – here.
Version 1.2 full changelog – here.
Comments on updates to pgwatch for version 1.2
- Add possibility to monitor all databases for a host automatically
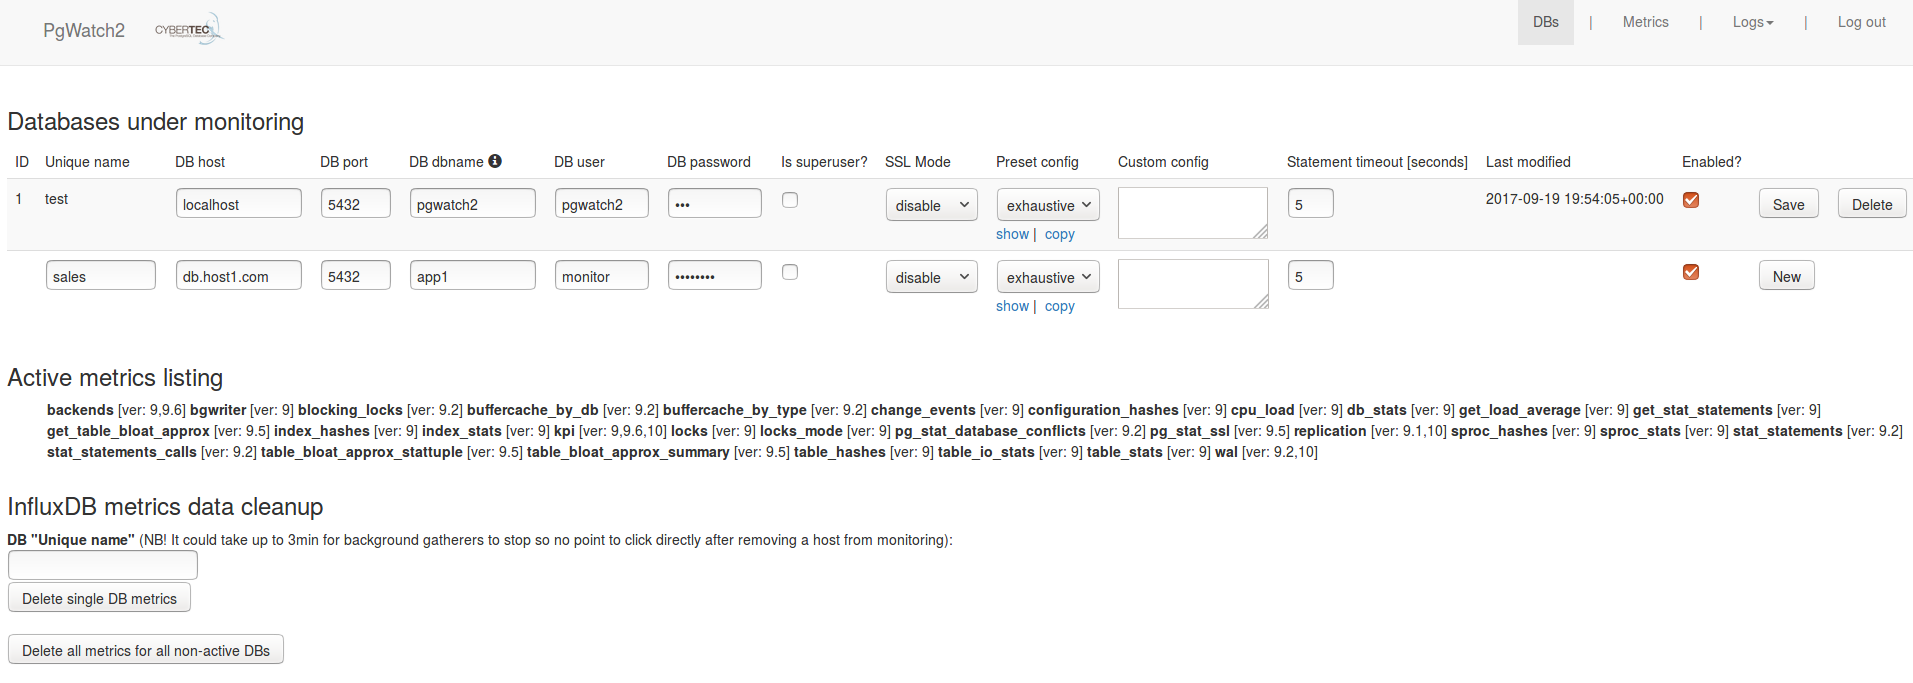
Previously one had to add all databases manually for a multi-db cluster, but now when leaving the “DB name” empty all DB-s are fetched, with those already being monitored skipped. A tip – when not sure what databases are there, uncheck the “Enabled” flag to review/enable/delete the found DB-s in the second step.
- Enable deletion of InfluxDB metrics data from the Web UI
Previously this was only possible if connecting to the InfluxDB yourself via command line for example. Note that when removing a Postgres database host from monitoring, the gathered metrics are not automatically dropped as metrics gatherers work in the background and will take a minute or two to stop, so that’s the reason for two separate buttons.
- Enabling use of pre-existing Postgres/Grafana/InfluxDB installations from Docker
Previously this was only possible when running the metrics gatherer and the config UI as standalone components, now there are bunch of environment variables available for that. See the README for details.
- A flag to disable monitoring of the “test” demo database
By default the demo database is there to make it easy for getting a first impression for new users, but for advanced users it could be tedious to remove the configuration and delete the metrics data from InfluxDB so now there a flag for that. Set NOTESTDB=1 for example to avoid monitoring the test DB.
- Config store Postgres DB is now UTF-8 to avoid problems with “funny” Grafana dashboard names
- Corrections and better documentation for the backup/restore script for Docker image upgrades. See README for more
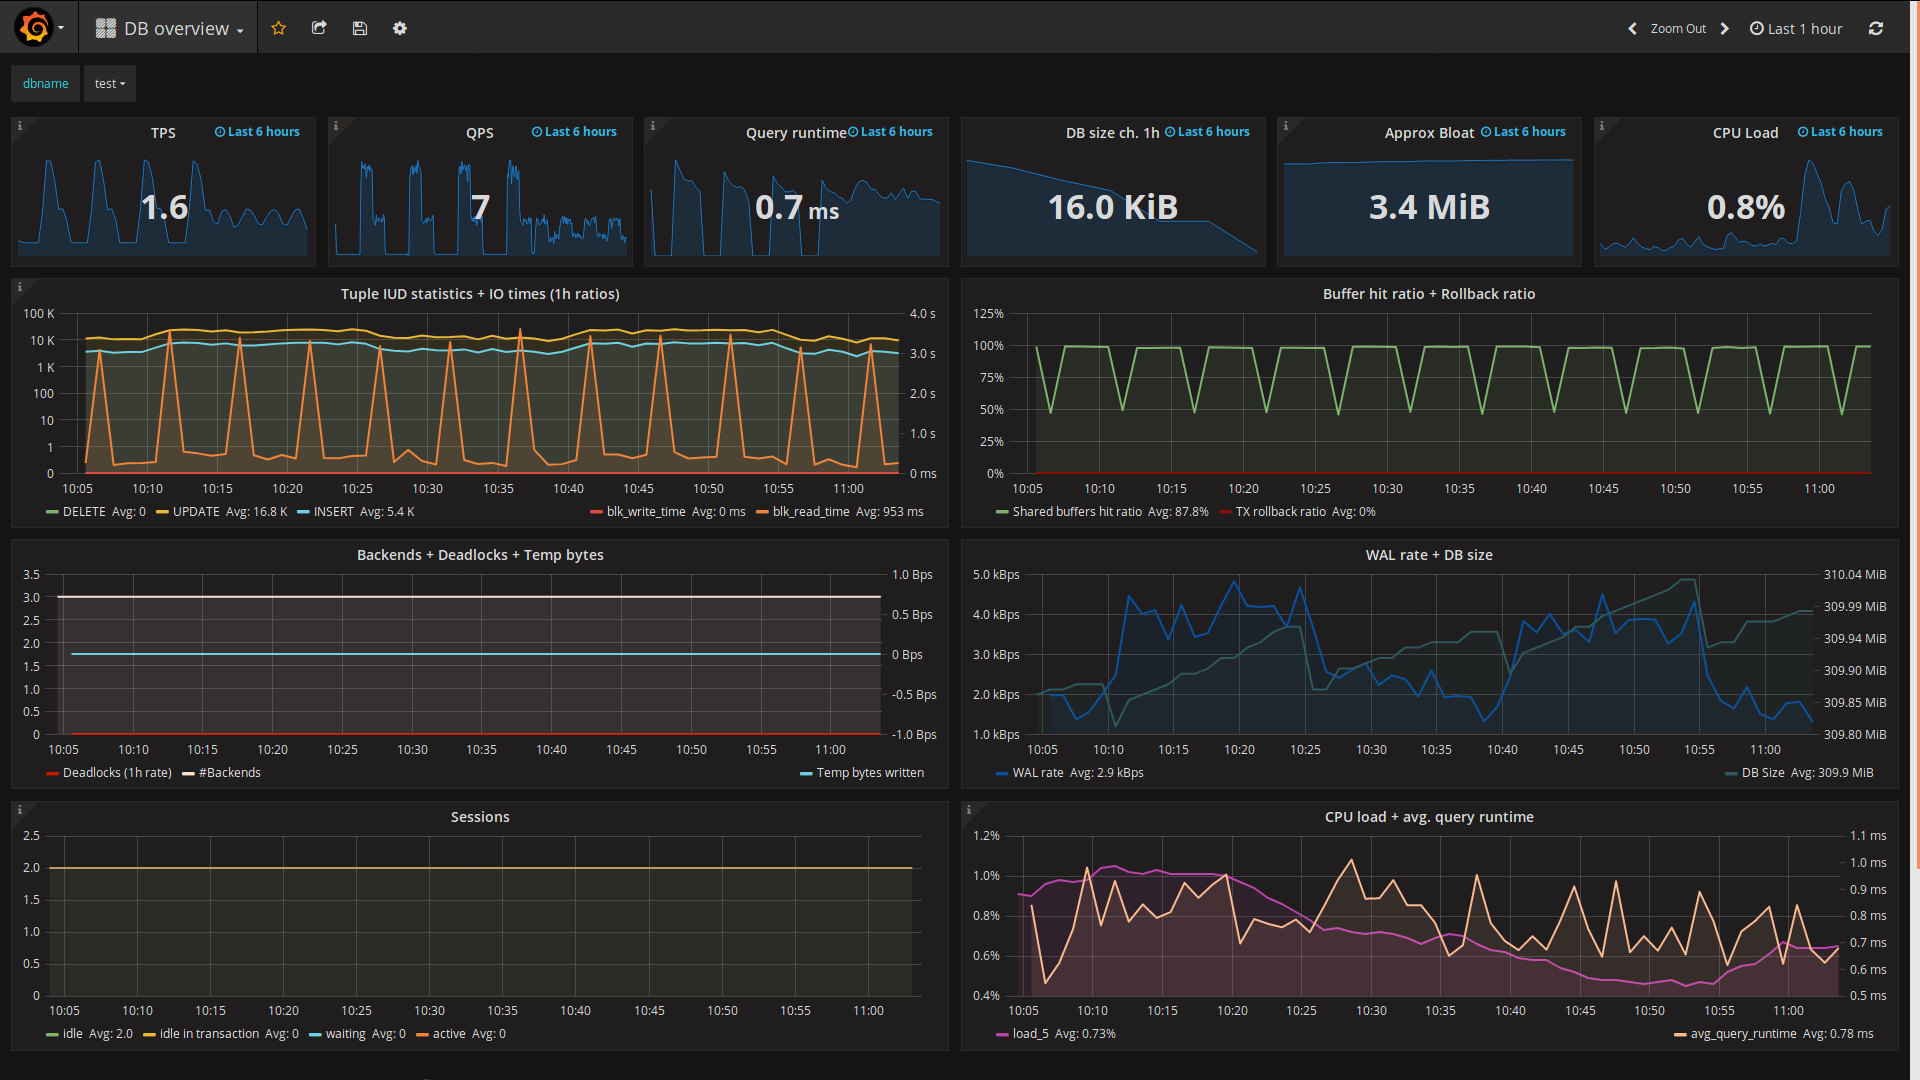
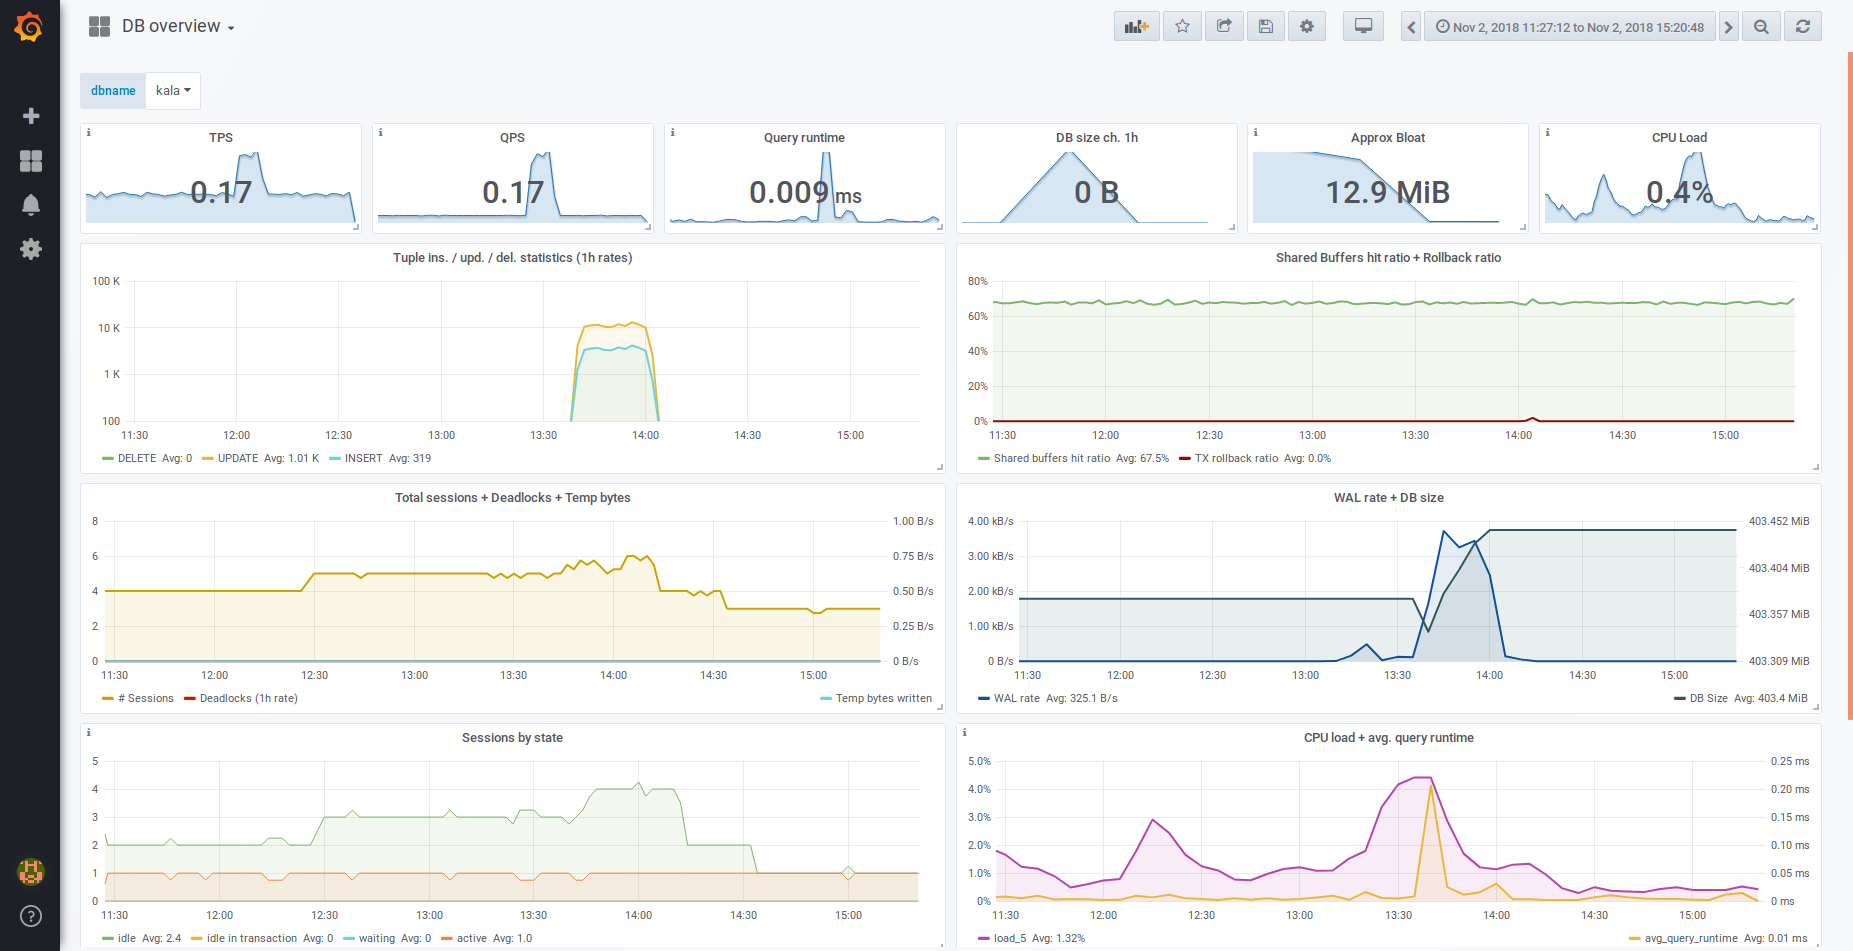
- Corrections to default dashboards
pgwatch2 provides out-of-the-box some sample dashboards to get going quickly but creating new ones is a point-and-click effort.
- Latest Grafana and InfluxDB versions
Grafana 4.5.1 and InfluxDB 1.3.5.
pgwatch2 is constantly being improved and new features are added. Learn more >>
Screenshots
Overview dashboard
Overview dashboard light theme
Configuring monitored databases